

One significant capability of Flower is to simulate large federations. Using simulations, researchers can test their ideas and conduct federated learning research without running large federations. All of that in a friendly, fast, and easy manner. This blog post aims to introduce and explain how metrics monitoring with tools such as Prometheus and Grafana works.
After this tutorial, you will know how to monitor your system resources when running your simulation. Hopefully, this will enable you to optimize resource allocation while running experiments using the simulation engine of Flower.
This tutorial assumes that you are somewhat experienced in using a terminal and that you are working on macOS. All tools used are also available on most Linux distributions but might require you to consult their respective documentation.
Downloads
Before getting started, you will need to install a few things—specifically, Prometheus and Grafana. Prometheus is used for data collection, while Grafana will enable you to visualize the collected data.
As a macOS user, you may use brew to install both.
brew install prometheus grafanaAs soon as brew is finished, you will need to overwrite the configuration files which were generated in the process. There will be slight differences for M1 and Intel macOS users, which are explained subsequently.
Given you are on an M1 Mac, it should be:
/opt/homebrew/etc/prometheus.yml
/opt/homebrew/etc/grafana/grafana.ini
On the previous generation Intel Mac devices, it should be:
/usr/local/etc/prometheus.yml
/usr/local/etc/grafana/grafana.ini
Using your preferred editor, open the respective configuration files and change them. You may use the following command in your terminal to open the Prometheus configuration for editing:
Depending on your device, use one of the two following commands:
# M1 macOS
open /opt/homebrew/etc/prometheus.yml

# Intel macOS
open /usr/local/etc/prometheus.yml
and then delete all the text in the file and paste a new Prometheus config you see below. You may adjust the time intervals to your requirements:
global:
  scrape_interval: 1s
  evaluation_interval: 1s

scrape_configs:
# Scrape from each ray node as defined in the service_discovery.json provided by ray.
- job_name: 'ray'
  file_sd_configs:
  - files:
    - '/tmp/ray/prom_metrics_service_discovery.json'
Now after you have edited the Prometheus configuration, do the same with the Grafana configuration files. Open those using one of the following commands as before:
# M1 macOS
open /opt/homebrew/etc/grafana/grafana.ini

# Intel macOS
/usr/local/etc/grafana/grafana.ini
Your terminal editor should open and allow you to apply the following configuration as before.
[security]
allow_embedding = true

[auth.anonymous]
enabled = true
org_name = Main Org.
org_role = Viewer

[paths]
provisioning = /tmp/ray/session_latest/metrics/grafana/provisioning
Congratulations! You have just downloaded all the necessary tools needed for tracking system metrics. Now, let's start it.
Tracking metrics
Before running your Flower simulation, you have to start the monitoring tools you have just installed and configured.
brew services start prometheus
brew services start grafana
Please include the following argument in your Python code when starting a simulation.
fl.simulation.start_simulation(
    # ...
    # all the args you used before
    # ...
    ray_init_args = {"include_dashboard": True}
)
Now, you are ready to start your workload.
Shortly after the simulation starts, you should see the following logs in your terminal:
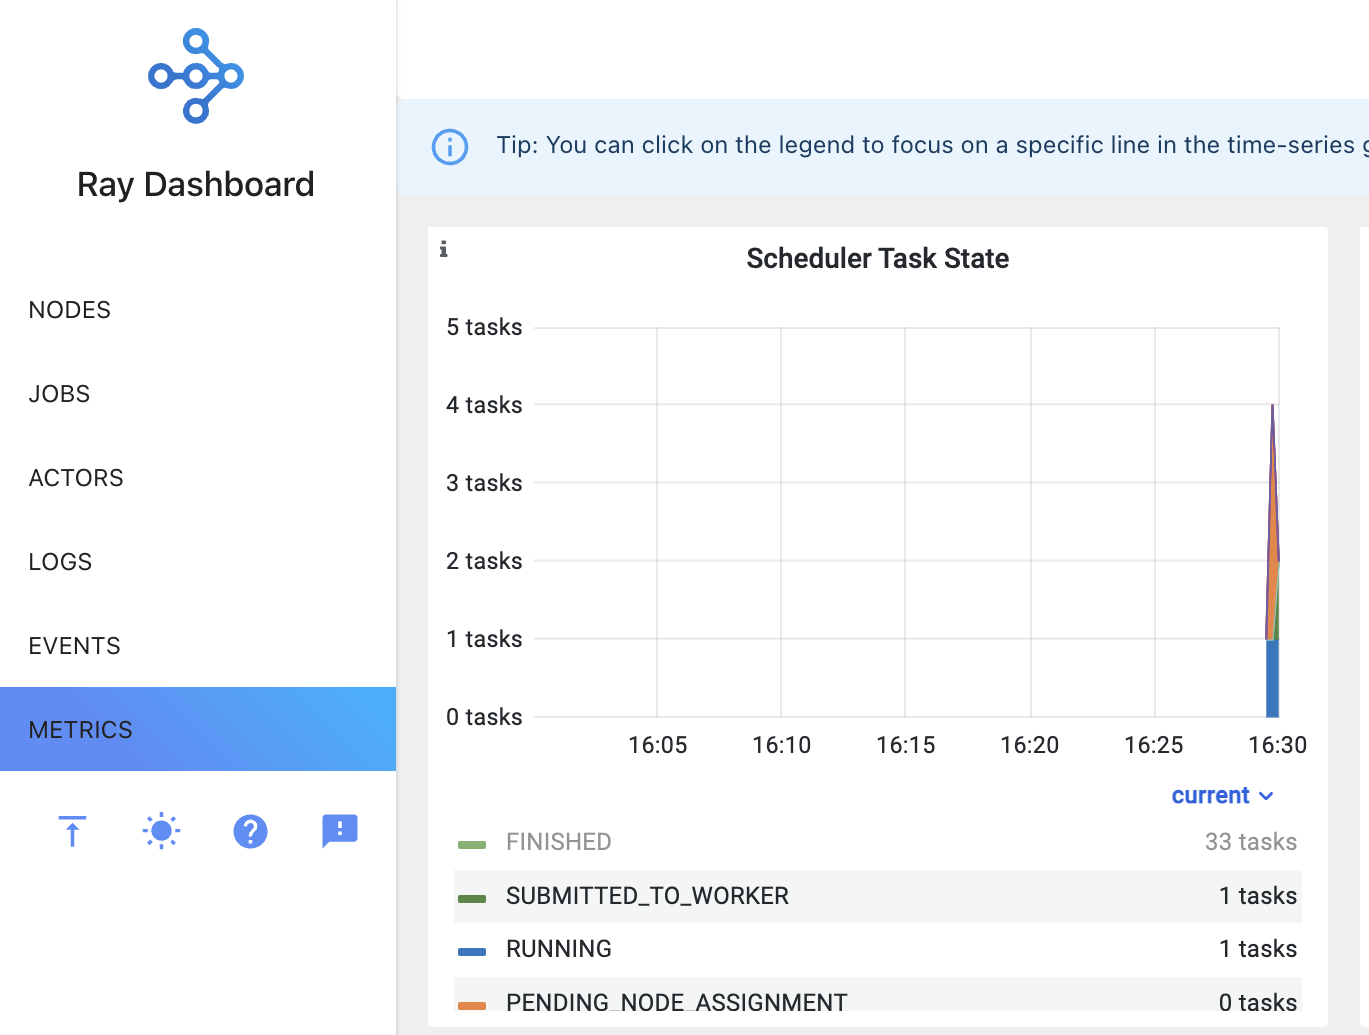
2023-01-20 16:22:58,620 INFO [worker.py:1529](http://worker.py:1529/) -- Started a local Ray instance. View the dashboard at [http://127.0.0.1:8265](http://127.0.0.1:8265/)You can look at everything at http://127.0.0.1:8265 (either click it or paste it to a browser you use).
It's a Ray Dashboard. You can navigate to Metrics (on the left panel, the lowest option).
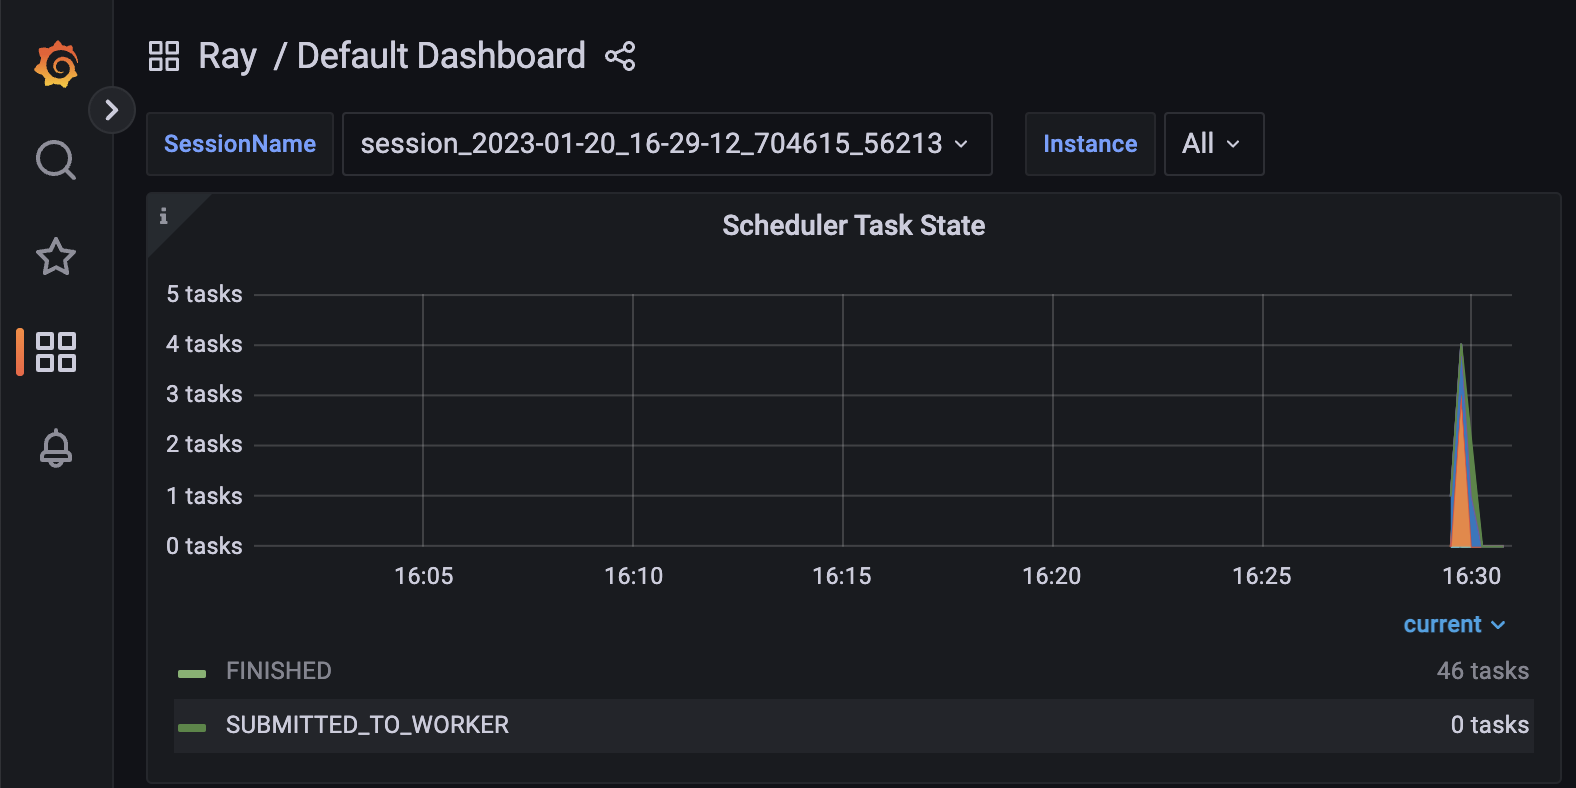
Alternatively, you can see them in Grafana by clicking on the right-up corner, "View in Grafana." Please note that the Ray dashboard is only accessible during the simulation. After the simulation ends, you can only use Grafana to explore the metrics. You can open the Grafana dashboard by going to http://localhost:3000/.
After you finish the visualization, stop Prometheus and Grafana. This is important as they will otherwise block, e.g. port 3000 on your machine as long as they are running.
brew services stop prometheus
brew services stop grafana
Resource allocation
You must understand how the Ray library works to efficiently allocate system resources to simulation clients on your own.
Initially, the simulation (which Ray handles under the hood) starts by default with all the available resources on the system, which it shares among the clients. It doesn't mean it divides it equally among all of them, nor that the model training happens at all of them simultaneously. You will learn more about that in the later part of this blog. You can check the system resources by running the following:
import ray
ray.available_resources()
In Google Colab, the result you see might be similar to this:
{'memory': 8020104807.0,
 'GPU': 1.0,
 'object_store_memory': 4010052403.0,
 'CPU': 2.0,
 'accelerator_type:T4': 1.0,
 'node:172.28.0.2': 1.0}
However, you can overwrite the defaults. When starting a simulation, do the following (you don't need to overwrite all of them):
num_cpus = 2
num_gpus = 1
ram_memory = 16_000 * 1024 * 1024 # 16 GB
fl.simulation.start_simulation(
    # ...
    # all the args you were specifying before
    # ...
    ray_init_args = {
            "include_dashboard": True, # we need this one for tracking
            "num_cpus": num_cpus,
            "num_gpus": num_gpus,
            "memory": ram_memory,
   }
)
And now, let's also specify the resource for a single client.
# Total resources for simulation
num_cpus = 4
num_gpus = 1
ram_memory = 16_000 * 1024 * 1024 # 16 GB

# Single client resources
client_num_cpus = 2
client_num_gpus = 1

fl.simulation.start_simulation(
    # ...
    # all the args you were specifying before
    # ...
    ray_init_args = {
            "include_dashboard": True, # we need this one for tracking
            "num_cpus": num_cpus,
            "num_gpus": num_gpus,
            "memory": ram_memory,
    },
    # The argument below is new
    client_resources = {
            "num_cpus": client_num_cpus,
            "num_gpus": client_num_gpus,
    }
)
Now comes the crucial part. Ray will start a new client only when it has all the required resources (such that they run in parallel) when the resources allow.
In the example above, only one client will be run, so your clients won't run concurrently. Setting client_num_gpus = 0.5 would allow running two clients and therefore enable them to run concurrently. Be careful not to require more resources than are available. If you specified client_num_gpus = 2, the simulation wouldn't start (even if you had 2 GPUs but decided to set 1 in ray_init_args).
FAQ
Q: I don't see any metrics logged.
A: Probably, you don't have a proper timeframe set. It is in the top right corner ("Last 30 minutes" by default). Please change the timeframe to reflect the period when the simulation was running.
Q: I see “Grafana server not detected. Please make sure the Grafana server is running and refresh this page” after going to the Metrics tab in Ray Dashboard.
A: You probably don't have the Grafana running. Please check the running services
brew services listQ: I see "This site can't be reached" when going to http://127.0.0.1:8265.
A: Either the simulation has already finished, or you still need to start Prometheus.
Resources
Ray Dashboard: https://docs.ray.io/en/latest/ray-core/ray-dashboard.html
Ray Metrics: https://docs.ray.io/en/latest/ray-observability/ray-metrics.html